Veja também

 21.04.2026 07:13 AM
Bitcoin continues to show a semblance of an upward move, which has been a correction for over two months. This is clearly visible on the daily timeframe. A liquidity pool remains untouched below, which the price is likely to tap with a probability of 90%. We believe that in the near future, market makers may manipulate prices to convince traders that an upward trend has begun. Additionally, Bitcoin could form a sell signal, the first on the daily timeframe in recent months, in the nearest "bearish" FVG.
Meanwhile, experts from CryptoQuant have reported that activity on the Bitcoin network has fallen to an 8-year low. The latest estimate of the number of active addresses is 662,000. However, over the last two months, the price has remained stable, despite the previously observed correlation of "low activity – weak market." Experts note that this phenomenon can be explained quite simply: an increasing number of transactions are taking place not through the main network, but through various tools and derivatives, such as ETFs. Thus, they simply do not account for the general number of active addresses and transactions.
At the same time, analysts at Glassnode noted that retail investors remain indifferent toward Bitcoin and other cryptocurrencies. The Accumulation Trend Score index currently equals zero, indicating distribution (as mentioned in previous articles) or a lack of accumulation. Neither scenario suggests significant Bitcoin growth in the near future, let alone a trend. Glassnode stated that current activity levels clearly do not correspond to the market "bottom." Data on ETFs is also conflicting. For example, the IBIT tool from BlackRock recorded inflows of over 1,000 Bitcoins, while the FBTC and GBTC tools collectively lost about 800 Bitcoins. Thus, the supply and demand are approximately equal at this time, which again does not indicate the imminent start of a bullish trend.
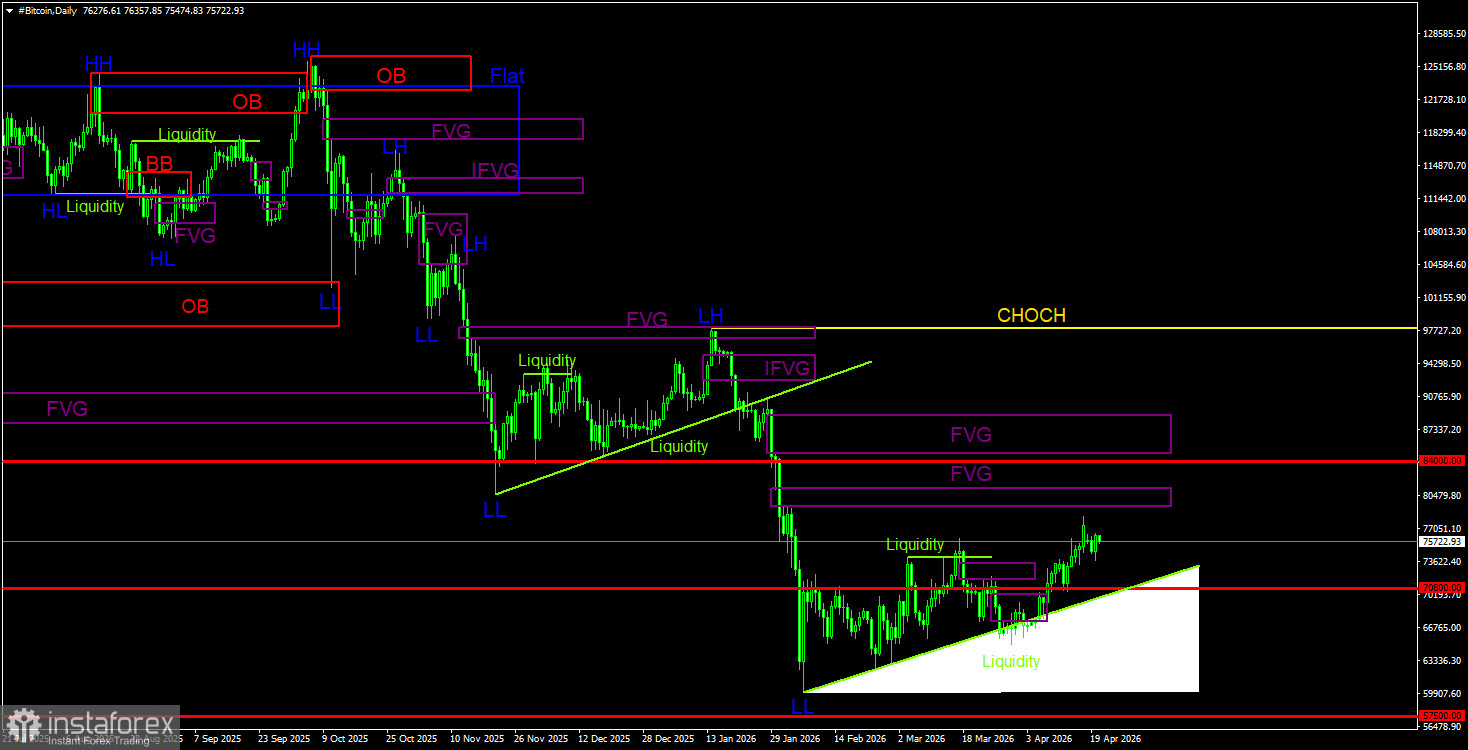
Bitcoin continues to form a full-fledged downward trend and correction against it. We continue to expect a decline targeting $57,500 (the 61.8% Fibonacci level from a three-year upward trend), with no signs of a trend reversal at this time. However, even the $57,500 level does not appear to be a final stop. Among the areas of interest at this time, only the nearest bearish FVG on the daily timeframe is noted, in the range of $79,300 - $81,200. On the 4-hour timeframe, local bullish patterns can be used for long positions, but it should be remembered that patterns on the daily timeframe are more important, and the correction has already been prolonged over time. On the 4-hour timeframe, we would recommend waiting for a break of the structure and then for the formation of bearish patterns and signals.
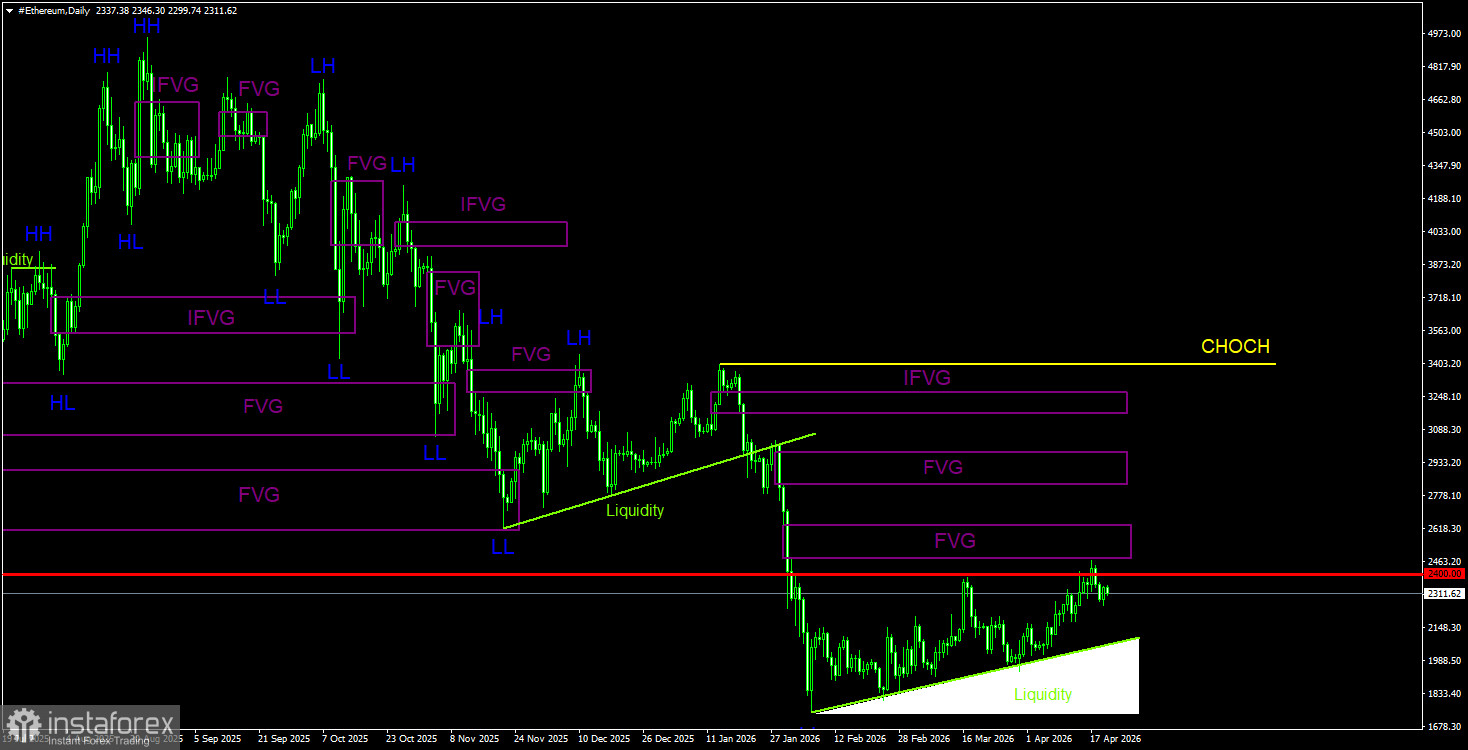
On the daily timeframe, a downward trend continues to form, along with a correction against it. The key sell pattern has been and remains the bearish order block on the weekly timeframe. As we warned, the movement provoked by this signal can be strong and prolonged. After its formation, Ethereum decreased by 65% or $3,200. In the near future, Ethereum may continue a weak upward correction, but any such correction will end sooner or later. On the 4-hour timeframe, Ethereum has processed all recent FVGs fairly well, but the movements remain weak and corrective. A sell signal may form on the daily timeframe in the nearest FVG. We remind you that a decline in Ethereum requires a decline in Bitcoin, and any signal needs confirmation on a timeframe two ranks lower than the current one.


